Only obey optimize-tests flag on UI tests that are run-pass

stage1 UI tests walltime on my machine:

```
optimize-tests = false, master
25.98s

optimize-tests = true, master
34.69s

optimize-tests = true, patched
28.79s
```

Effects:

- faster UI tests
- llvm asserts get exercised less on build-pass tests
- the difference between opt and nopt builds shrinks a bit
- aux libs don't get optimized since they don't have a pass mode and almost never have explicit compile flags
rustdoc: make source sidebar toggle a real button

This fixes tab focus, so that you can open and close the sidebar from keyboard.

This should cause no visible change in appearance at all. The only way you'd know anything different is if you tried to use keyboard controls to open the source code file navigation sidebar.

Separated out from #98772
All derive ops currently use match-destructuring to access fields. This
is reasonable for enums, but sub-optimal for structs. E.g.:
```
fn eq(&self, other: &Point) -> bool {
    match *other {
	Self { x: ref __self_1_0, y: ref __self_1_1 } =>
	    match *self {
		Self { x: ref __self_0_0, y: ref __self_0_1 } =>
		    (*__self_0_0) == (*__self_1_0) &&
			(*__self_0_1) == (*__self_1_1),
	    },
    }
}
```
This commit changes derive ops on structs to use field access instead, e.g.:
```
fn eq(&self, other: &Point) -> bool {
    self.x == other.x && self.y == other.y
}
```
This is faster to compile, results in smaller binaries, and is simpler to
generate. Unfortunately, we have to keep the old pattern generating code around
for `repr(packed)` structs because something like `&self.x` (which doesn't show
up in `PartialEq` ops, but does show up in `Debug` and `Hash` ops) isn't
allowed. But this commit at least changes those cases to use let-destructuring
instead of match-destructuring, e.g.:
```
fn hash<__H: ::core:#️⃣:Hasher>(&self, state: &mut __H) -> () {
    {
	let Self(ref __self_0_0) = *self;
	{ ::core:#️⃣:Hash::hash(&(*__self_0_0), state) }
    }
}
```
There are some unnecessary blocks remaining in the generated code, but I
will fix them in a follow-up PR.
Rollup of 4 pull requests

Successful merges:

 - #94831 (Link to stabilization section in std-dev-guide for library tracking issue template)
 - #98764 (add Miri to the nightly docs)
 - #98773 (rustdoc: use <details> tag for the source code sidebar)
 - #98799 (Fix bug in `rustdoc -Whelp`)

Failed merges:

r? `@ghost`
`@rustbot` modify labels: rollup
Fix bug in `rustdoc -Whelp`

Previously, this printed the debugging options, not the lint options,
and only handled `-Whelp`, not `-A/-D/-F`.

This also fixes a few other misc issues:
- Fix `// check-stdout` for UI tests; previously it only worked for run-fail and compile-fail tests
- Add lint headers for tool lints, not just builtin lints

https://github.com/rust-lang/rust/pull/98533#issuecomment-1172004197

r? ```@GuillaumeGomez```
rustdoc: use <details> tag for the source code sidebar

This fixes the extremely poor accessibility of the old system, making it possible to navigate the sidebar by keyboard, and also implicitly gives the sidebar items the correct ARIA roles.

Split out separately from #98772
Clean up submodule checkout scripts

This is just some small cleanup:

* Removed unused CACHE_DIR stuff
* Removed duplicate fetch_github_commit_archive function which is no longer used
* Combined init_repo.sh and checkout-submodules.sh, as checkout-submodules.sh was doing nothing but calling init_repo.sh
`impl<T: AsRawFd> AsRawFd for {Arc,Box}<T>`

This allows implementing traits that require a raw FD on Arc and Box.

Previously, you'd have to add the function to the trait itself:

```rust
trait MyTrait {
    fn as_raw_fd(&self) -> RawFd;
}

impl<T: MyTrait> MyTrait for Arc<T> {
    fn as_raw_fd(&self) -> RawFd {
        (**self).as_raw_fd()
    }
}
```

In particular, this leads to lots of "multiple applicable items in scope" errors because you have to disambiguate `MyTrait::as_raw_fd` from `AsRawFd::as_raw_fd` at each call site. In generic contexts, when passing the type to a function that takes `impl AsRawFd` it's also sometimes required to use `T: MyTrait + AsRawFd`, which wouldn't be necessary if I could write `MyTrait: AsRawFd`.

After this PR, the code can be simpler:
```rust
trait MyTrait: AsRawFd {}

impl<T: MyTrait> MyTrait for Arc<T> {}
```
Optimize `Vec::insert` for the case where `index == len`.

By skipping the call to `copy` with a zero length. This makes it closer
to `push`.

I did this recently for `SmallVec`
(https://github.com/servo/rust-smallvec/pull/282) and it was a big perf win in
one case. Although I don't have a specific use case in mind, it seems
worth doing it for `Vec` as well.

Things to note:
- In the `index < len` case, the number of conditions checked is
  unchanged.
- In the `index == len` case, the number of conditions checked increases
  by one, but the more expensive zero-length copy is avoided.
- In the `index > len` case the code now reserves space for the extra
  element before panicking. This seems like an unimportant change.

r? `@cuviper`
get rid of `tcx` in deadlock handler when parallel compilation
This is a very obscure and hard-to-trace problem that affects thread scheduling. If we copy `tcx` to the deadlock handler thread, it will perform unpredictable behavior and cause very weird problems when executing `try_collect_active_jobs`(For example, the deadlock handler thread suddenly preempts the content of the blocked worker thread and executes the unknown judgment branch, like #94654).
Fortunately we can avoid this behavior by precomputing `query_map`. This change fixes the following ui tests failure on my environment when set `parallel-compiler = true`:
```
[ui] src/test\ui\async-await\no-const-async.rs
[ui] src/test\ui\infinite\infinite-struct.rs
[ui] src/test\ui\infinite\infinite-tag-type-recursion.rs
[ui] src/test\ui\issues\issue-3008-1.rs
[ui] src/test\ui\issues\issue-3008-2.rs
[ui] src/test\ui\issues\issue-32326.rs
[ui] src/test\ui\issues\issue-57271.rs
[ui] src/test\ui\issues\issue-72554.rs
[ui] src/test\ui\parser\fn-header-semantic-fail.rs
[ui] src/test\ui\union\union-nonrepresentable.rs
```
Updates #75760Fixes#94654
Fix `x dist rust-dev` on a fresh checkout

Previously, it required you to manually run `x build` first, because it
assumed the LLVM binaries were already present.
```
optimize-tests = false, master
25.98s

optimize-tests = true, master
34.69s

optimize-tests = true, patched
28.79s
```

Effects:

- faster UI tests
- llvm asserts get exercised less on build-pass tests
- the difference between opt and nopt builds shrinks a bit
- aux libs don't get optimized since they don't have a pass mode and almost never have explicit compile flags
CTFE interning: don't walk allocations that don't need it
The interning of const allocations visits the mplace looking for references to intern. Walking big aggregates like big static arrays can be costly, so we only do it if the allocation we're interning contains references or interior mutability.
Walking ZSTs was avoided before, and this optimization is now applied to cases where there are no references/relocations either.
---
While initially looking at this in the context of #93215, I've been testing with smaller allocations than the 16GB one in that issue, and with different init/uninit patterns (esp. via padding).
In that example, by default, `eval_to_allocation_raw` is the heaviest query followed by `incr_comp_serialize_result_cache`. So I'll show numbers when incremental compilation is disabled, to focus on the const allocations themselves at 95% of the compilation time, at bigger array sizes on these minimal examples like `static ARRAY: [u64; LEN] = [0; LEN];`.
That is a close construction to parts of the `ctfe-stress-test-5` benchmark, which has const allocations in the megabytes, while most crates usually have way smaller ones. This PR will have the most impact in these situations, as the walk during the interning starts to dominate the runtime.
Unicode crates (some of which are present in our benchmarks) like `ucd`, `encoding_rs`, etc come to mind as having bigger than usual allocations as well, because of big tables of code points (in the hundreds of KB, so still an order of magnitude or 2 less than the stress test).
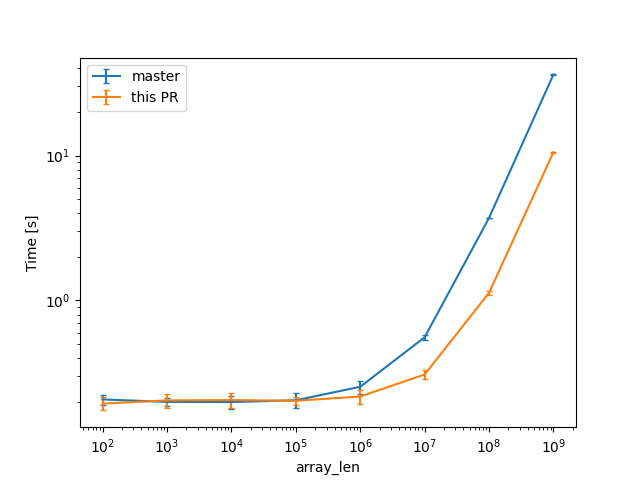
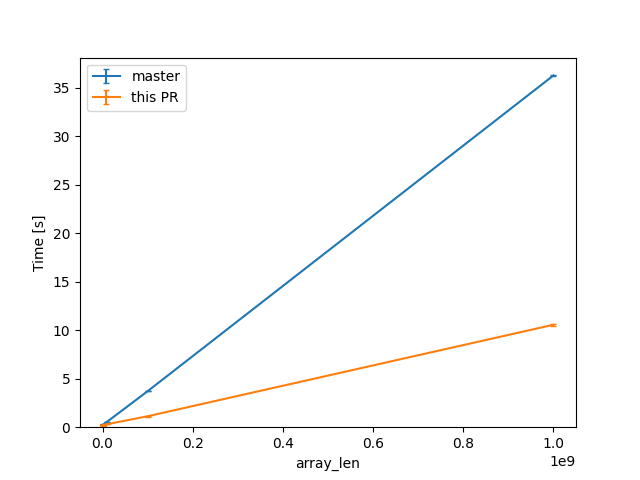
In a check build, for a single static array shown above, from 100 to 10^9 u64s (for lengths in powers of ten), the constant factors are lowered:
(log scales for easier comparisons)

(linear scale for absolute diff at higher Ns)

For one of the alternatives of that issue
```rust
const ROWS: usize = 100_000;
const COLS: usize = 10_000;
static TWODARRAY: [[u128; COLS]; ROWS] = [[0; COLS]; ROWS];
```
we can see a similar reduction of around 3x (from 38s to 12s or so).
For the same size, the slowest case IIRC is when there are uninitialized bytes e.g. via padding
```rust
const ROWS: usize = 100_000;
const COLS: usize = 10_000;
static TWODARRAY: [[(u64, u8); COLS]; ROWS] = [[(0, 0); COLS]; ROWS];
```
then interning/walking does not dominate anymore (but means there is likely still some interesting work left to do here).
Compile times in this case rise up quite a bit, and avoiding interning walks has less impact: around 23%, from 730s on master to 568s with this PR.